

A common task in the performance analysis of an investment portfolio is to convert results into an annual form. Data often comes as a set of monthly returns which must be turned into a set of meaningful yearly statistics. These statistics can be used to compare different investment portfolios over possibly different time periods. It is only fair to the portfolio managers when such statistics are expressed in similar units of time.
Most performance analysts are aware that you cannot simply multiply an average monthly return by 12 to get an annualized return. This is because returns do not sum but instead compound over time. For example: a return of 10% in the first month, followed by a return of 20% in the second month, gives a return of 32% over both months, which contains not only the sum of both returns (30%), but also their product (2%).
Annualizing volatility
The conversion from monthly to annual risk measures is much less understood. To convert the volatility (standard deviation), which is one of the most common risk measures, practitioners are using the following rule of thumb: multiply the monthly volatility by √12 (≈ 3.46). This method is incorrect however, since it assumes that returns are summing over time, and ignores the effect of compounding that occurs in reality.Fortunately, there is a method to calculate the annual volatility correctly by taking compounding effects into account. Ortec Finance’s Arno Weber some time ago described and explained in The Journal Of Performance Measurement how this method works in practice.
Practical examples
Below table considers three portfolios having the same monthly volatility of 6 percent, but different monthly mean returns.
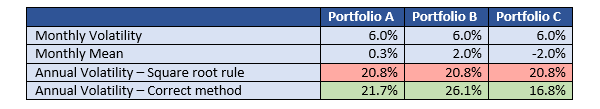
When applying the square root rule, all three portfolios get the same annual volatility of 20.8 percent. But when using the correct method the annual volatilities show significant different results, depending on the monthly mean return. If the monthly mean is low, like in the case of Portfolio A, the square root method gives a rough estimate of the factual result. If the monthly mean is highly positive, as for Portfolio B, the square root method significantly underestimates the correct annual volatility. Lastly, if the monthly mean is highly negative, as for Portfolio C, the square root method overestimates the annual volatility.
Improve decision making
In a manager selection process where portfolio managers are selected by taking into account the risk profile (volatility) of their portfolios, it is important to consider whether to compare the monthly or annual volatility, or both. If the monthly volatilities are the same, the annual volatility may be significantly different, as the examples above illustrate. Thus, the factual method for converting to the annual volatility helps to improve making decisions like selecting a portfolio manager.The method extended to other risk measures
The article by Arno Weber specifies the correct annualization method of the volatility. As an extension, it uncovers a general methodology which can be used to annualize any risk measure based on monthly returns, taking return compounding into account. Think for example of the covariance, active risk, information ratio, beta, alpha, downside risk and the value-at-risk.Reference
Weber, Arno E., “Annual Risk Measures and Related Statistics”, The Journal of Performance Measurement, Spring 2017.More information?
Interested in reading the full article?
If you are interested to learn more about our performance measurement and attribution solution, click here.
Related Insights
-
 17 April 2024Quarterly Pensions Investments Review
The Quarterly Pensions Investments Review is a comparison in expected risk and investment return.
-
 17 April 2024PRESS RELEASE: Ortec Finance’s 2024 climate scenario update – Key highlights
Impacts of current El Niño anticipated to lower global GDP by 0.25% over the next two years and affect all asset classes
-
 09 April 2024PRESS RELEASE: Ortec Finance releases integrated economic and climate scenarios
Find out more about the industry’s first integrated economic and climate risk management tool.
-
 26 March 2024Insurers need strategies to manage increasing complexity
Study shows a need for greater transparency and regulatory pressure is driving insurer spending on scenario analysis and stress testing.
-
 25 March 2024Qantas Super partners with Ortec Finance to implement PEARL investment performance software
Qantas Super an Australian corporate superannuation fund with $8.9 billion in assets, has integrated Ortec Finance’s performance attribution platform, PEARL, to enhance their performance and attribution capabilities.
-
 19 March 2024In-House Student Day: Thursday 30 May, 2024 - Rotterdam
Calling all students! Join us for an unforgettable day of insights and inspiration at our exclusive In-House Student Day.
-
 13 March 2024Save the date: ‘Barometer’ climate risk workshop
Climate risk workshop for pension funds and insurance companies
-
 12 March 2024WEBINAR: 2024 Ortec Finance Climate Scenarios
Learn how to utilize Ortec Finance’s 2024 climate scenarios to help inform investment decisions
-
 12 March 2024PRESS RELEASE: Insurers ‘increasingly concerned about greenwashing’
Global study shows nearly half are very concerned about the issue.