

In blog 6 in the series, we look at some specific case studies to highlight how alternative endgame arrangements can deliver meaningful financial benefits for both sponsors and members.
Pension scheme
Run-on
The pension scheme in both case studies is 105% funded on a low-dependency basis of gilts+0.5% p.a., with a liability value of £3bn.Captive Insurance
The pension scheme in both case studies is 105% funded on a low-dependency basis of gilts+0.5% p.a., with a liability value of £3bn.Timeframe
Run-on
10 yearsCaptive Insurance
10 yearsInvestment strategy
Run-on
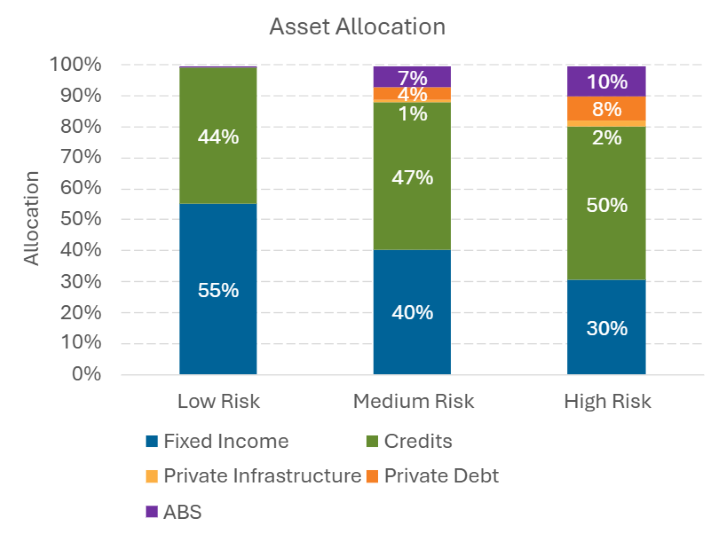
Captive Insurance
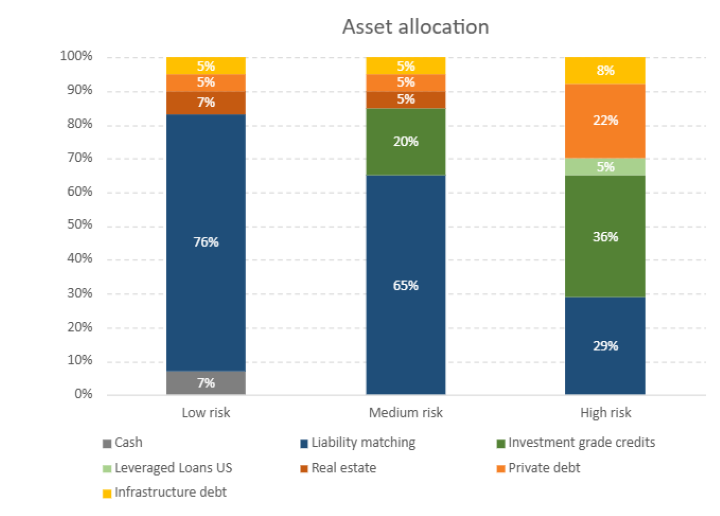
Surplus extraction framework
Run-on
- At the end of each year
- When the funding level reaches 110% on the low-dependency basis, excess surplus above this threshold may be extracted; and
- If the funding level falls below 100% on the low-dependency basis, then a lump sum deficit contribution will be made to bring the funding level back to 100%.
Captive Insurance
- At the end of each year
- 100% of surplus is distributed back to the sponsor in the form of dividend payments when the Solvency Capital Ratio (SCR) is over 135% at the year-end; and
- The sponsor needs to provide sufficient capital to the captive insurer to bring the SCR back to 125% when it falls below.
Regulatory framework
Run-on
Pension Scheme - UKCaptive Insurance
Life Insurance - Bermuda SCRAdditional capital
Run-on
n/aCaptive Insurance
We assume an extra £1bn of capital is held in surety bonds from inception to ensure the captive insurer’s solvency level is in line with its operating solvency target. This £1bn is modelled in our stochastic ALM tool (GLASS) as a separate balance sheet item. It is not invested and is used solely in the solvency calculation.Other assumptions
- Deficit‑reduction contributions/capital injections, and surplus/net profits are discounted at 8% p.a., reflecting the assumed cost of capital for a hypothetical sponsoring company.
- Tax and expenses are ignored.
- Additionally, in the captive insurance case study, fronting insurer fees and captive set‑up costs are also ignored.
Our stochastic ALM tool, GLASS, can incorporate tax, investment and other expense in the analysis. We simply excluded these in factors in both case studies because they can vary materially from one scheme to another.
Given the sensitivity of outcomes to these assumptions—as well as differences in scheme design and stakeholder risk appetite—the results can vary significantly. This highlights the importance of performing a scheme‑specific stochastic ALM analysis to assess the value of endgame options for each indicial case.
Net NPV
Run-on
Captive Insurance
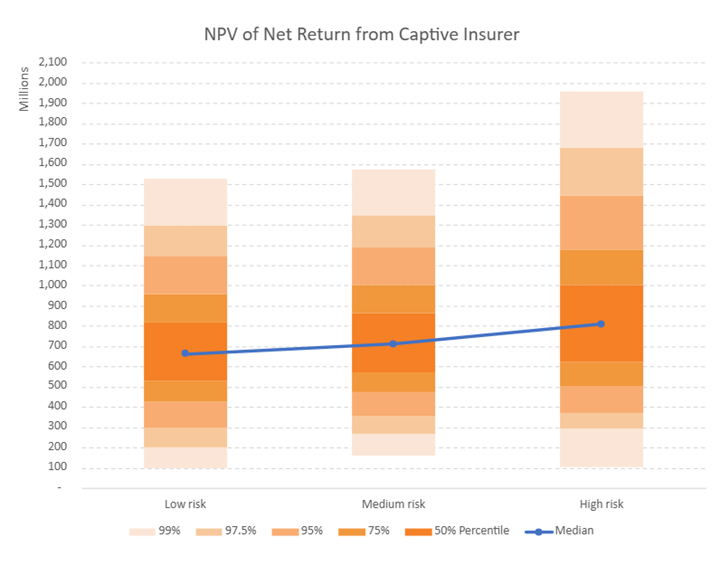
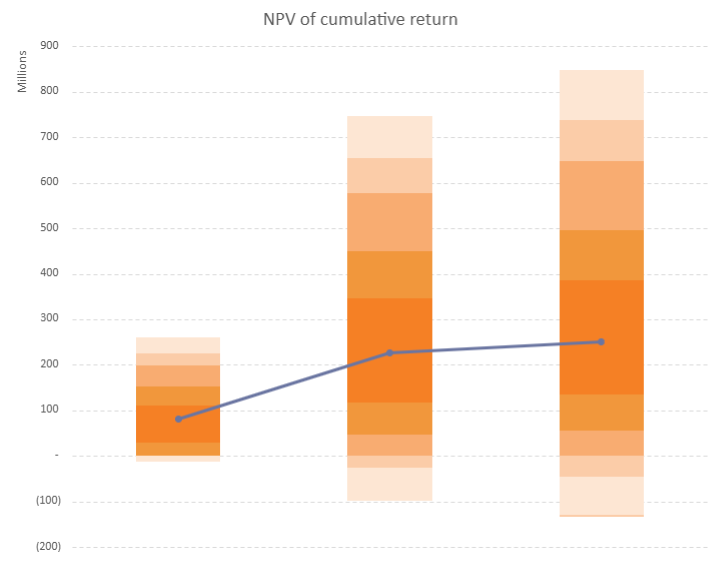
The charts above show the cumulative Net Present Value (NPV) of net return (surplus extracted minus capital injected) under each investment strategy over the next 10 years, a key metric for sponsors weighing the endgame options for their DB schemes. The results show that the higher the level of risk, the greater the return, and is skewed to the upside, which is a logical conclusion.
The captive insurance option appears more attractive compared to the run-on option because:
- Fronting insurer fees and set up costs of captive insurer is excluded. Users can either deduct these costs from the NPV or embed them in the stochastic projection to assess the expected return, reflecting their unique circumstances.
- The insurance regulatory framework is generally more stringent than that for pension schemes. As a result, the median expected capital required to restore the solvency level back to the target is higher across all three investment strategies. The range of the expected capital requirement is also wider. Please see charts below for more information.
Contributions
Run-on
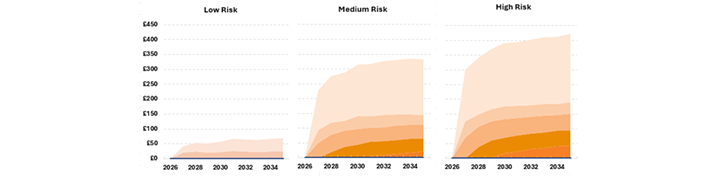
Captive Insurance
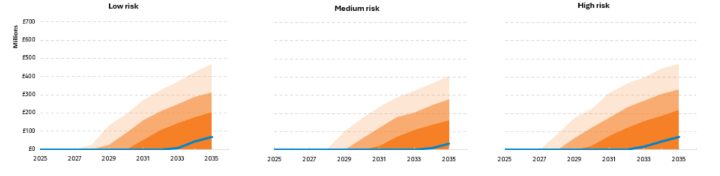
Conclusion
The case studies above highlight how alternative endgame arrangements can deliver meaningful financial benefits for both sponsors and members. However, the outcomes can be very sensitive to the underlying assumptions and scheme‑specific factors that feed into the analysis. These include, but are not limited to:
- Scheme asset and liability size
- Current funding level
- Time horizon for running- on or implementing a captive solution
- Investment strategy
- Sponsor and trustee risk tolerance
- Surplus‑extraction framework (e.g., extraction/injection thresholds, frequency, and whether surplus is shared with members)
- Costs and expenses
- …
Given this complexity, careful assessment of ongoing investment risks is essential when evaluating endgame options. An approach that works well for one scheme or sponsor may be less appropriate for another. Therefore, trustees and sponsors must evaluate these options in the context of their own scheme’s circumstances.
Interested to know more?
This article is the sixth in our series on rethinking the endgame for UK defined benefit pension schemes,
Download the whitepaper for a full comparison of endgame options where we evaluate the options using GLASS.
Or access the full series, here
Contact

Ashish Doshi
Head of Insurance and Asset Management
Selina Wang
Senior Consultant - Insurance Solutions
Ben Hudson
Senior ConsultantRelated Insights
-
 15 October 2026Self-service reporting from P&A systems: Shaping the future of performance and attribution
Learn why self-service reporting from performance measurement and attribution systems strikes the right balance between control, consistency and efficiency.
-
 06 October 2026Quarterly Scenario webinar Q4 2026 - 'A New Cost of Capital? What Higher Rates and Resilient Growth Mean for Investors'
Join our October 27 Q4 outlook webinar to explore the future path of yields, the cost of capital and what that mean for investors.
-
 01 October 2026Advancing towards an integrated assessment of climate risk: Bridging top-down and bottom-up climate models
Join our event, jointly hosted with MSCI, to learn more about a pioneering approach to integrating top-down and bottom-up climate models.
-
 28 September 2026How could this year’s extreme heat impact institutional investment portfolios?
Explore what the recent unprecedent heat could potentially mean for a pension fund and insurer’s investment portfolio as well as their total balance sheets.
-
 28 September 2026How the ‘advice continuum’ is changing the game
The advice continuum is reshaping wealth management, from targeted support to holistic planning at scale.
-
 24 September 2026Webinar recording: Funding ratio attribution for asset owners under higher interest rates
Learn how to develop a funding/solvency attribution that encompasses a comprehensive view of the fund’s performance
-
 21 September 2026AP7 selects Ortec Finance's performance measurement and attribution solution - PEARL
Learn about why AP7 has selected PEARL to measure and analyze investment performance across its global equity and fixed income portfolios
-
15 September 2026Measuring and attributing decisions within an Investment Decision Process
Learn about our approach to measuring investment decisions that enables asset owners to understand decision’s contribution to the total fund performance.
-
 14 September 2026Overcoming performance measurement challenges in private markets
Explore a more robust approach to measuring and attributing performance across private assets-related decisions to achieve consistency and transparency