
As several top colleges and universities in the United States face potential tax and funding pressures, concerns are growing over their health and resilience. In theory, many of these educational institutions have substantial endowments to lean back on as a “rainy day” fund for quick cash. However, the perfect illiquidity storm may be brewing. On one hand, high relative allocations by endowments into private assets increase liquidity constraints. On the other hand, the educational institutions may face increasing capital needs in the event of federal fund freezes, research funding cuts, higher endowment taxes, as well as the potential loss of their tax-exempt status.
Our case study looks at the liquidity needs of Harvard University – the largest endowment in the United States. Recent proposals floated by the U.S. administration have led the Harvard endowment to explore $1B in secondary sales on their private equity investments, suggesting the need for higher liquidity. This statement leads us to the following question: is Harvard’s endowment facing a liquidity crisis?
Many endowments over the last decade have been increasing their investments into private assets in the hopes of generating higher returns. The recently proposed changes to funding and the tax code could put immediate pressure on the payout rates of endowments, increasing the need for available short-term liquidity. Using the Illiquid Asset module of GLASS – a proprietary Asset and Liability Management software offered by Ortec Finance – we can visualize both sides of this story and the potential liquidity crisis for Harvard.1 This visualization is valuable in informing endowments, OCIOs and consultants on potential liquidity risks, and ultimately helping plan managers design investment and commitment strategies in these uncertain times.
The push into illiquid assets
Since the financial crisis and stagnant or negative returns, many endowments have drastically increased their investments into private assets including private credit, private equity and venture capital. Most, if not all of these institutions – including Harvard and Yale – elected to change their investment model and led a transition to follow what is now called the Swensen’s Yale Model. The logic behind Swensen’s model (and a potential underestimation of liquidity demands) is rooted in the nature of these endowments: because they are long-term focused and follow a sustainable spending policy, they have the luxury to “sit on their money” and “invest for the long run”.

Figure 1: Source Data from Harvard Financial Statements 2018 and 2024
In the example of Harvard, the endowment’s public equity allocation shrank from 31 percent in 2018 to 14 percent in 2024. During the same period, the combined allocation to private equity and hedge funds rose from 37 percent to 71 percent. This strategy appeared to pay off for other educational institutions, as college endowments posted 11.2% returns in 2024, reaching a total value of $873.7 billion, an increase of more than $34 billion from 2023. Harvard holds the largest endowment among higher education institutions, achieving a 2024 market value of nearly $53 billion, in comparison to the $39 billion valuation in 2018.
Rising liquidity constraints
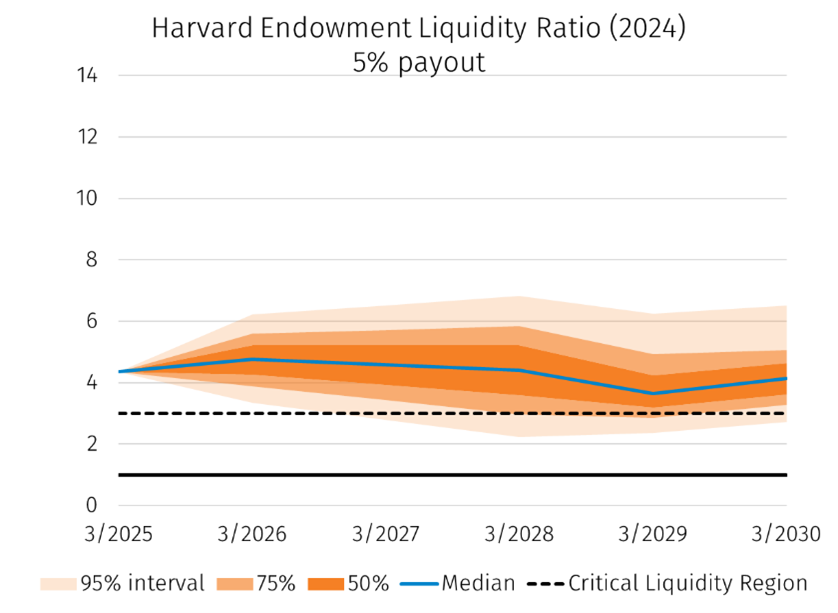
With the increase in private asset allocations from 2018 to 2024, Harvard’s available liquidity – as proportional to their average payout – shrank by over half. By using a liquidity ratio in our proprietary software GLASS, we can visualize how Harvard’s endowment liquidity was impacted by this change in investment strategy. The liquidity ratio is defined as the sum of liquid assets (public equity + bonds + cash) divided by the annual 5% payout of the endowment’s market value. This is meant to represent the proportion of liquid assets available to support the payout of standard costs to the university for that year.

A ratio well above one (critical liquidity ratio) indicates that the endowment holds enough liquid assets to meet Harvard’s annual payout obligations, whereas a ratio lower than one means that the endowment doesn’t have enough liquidity to cover the annual costs. A ratio of three suggests the endowment has enough liquid asset value to make the 5% payout for the following three years. We can therefore understand a Liquidity Ratio below three as a critical region where endowments can benefit from evaluating their liquidity position.
So, what happens if the endowment needs to pay out more than their commonplace 5% payout?
Cash crisis and the need for endowment liquidity
Endowment investments have been rooted in the idea that capital needs are predictable over the long term and thus hold the privilege of leaning into the illiquidity premium to boost returns. However, frozen federal funds, federal research funding cuts, visa restrictions on international students, proposed higher endowment taxes, and the potential loss of tax-exempt status threaten to turn this investment belief on its side. U.S. endowment funds may be needed immediately by their universities to support costs including research, operating, and increased taxes.
It is worth highlighting that university funding cuts pose a significant threat to the endowments. In Harvard’s case for 2024, the university received $686 million from federal agencies, accounting for two-thirds of its total sponsored research expenditure and 11 percent of the university’s operating revenue. In 2024, Harvard’s operating expenses reached $6.4 billion.
The two graphs below illustrate cases in which the Harvard endowment must not only meet its standard payout obligations but also cover an additional portion of operating expenses plus additional funds due to potential higher taxes or loss of international student revenue for the next five years of 15% ($960 million) or 25% ($1.6 billion). These extra expenditures can represent any cost incurred by the university, such as research expenses, salaries, infrastructure, and financial aid programs.
The additional financial pressure significantly reduces the initial liquidity ratio and, in each case, pushes the endowment into the critical liquidity region. A 15% shock lowers the liquidity ratio to around three, and a 25% shock pushes it below three. In more adverse ("bad weather") scenarios over a five-year horizon, liquidity ratios fall below two and, in some cases, near the critical liquidity ratio of one under the 15% and 25% stress cases. This means, there are potential scenarios in which the endowment would not have enough liquidity on hand to support their requirements, especially as the necessary expenses increase.


Ways to weather the storm: was it necessary to sell?
Harvard’s decision to explore secondary sales on their private equity investments is not ideal, especially as secondary sales are typically done at a discount to the original investment value. Nonetheless, through the Illiquid Asset module in GLASS, we can forecast scenarios in which the liquidity support is challenged, thereby significantly increasing the potential for lowering exposures to private assets to meet capital demands of the university.
Liquidity crises can happen at a moment’s notice. While the illiquidity premium can be enticing due to higher returns, the illiquid constraint can pose problems, as shown through our GLASS analysis. Given the uncertainties for endowment funds today, now may be time for plan managers to determine whether their portfolio structure will continue to produce adequate returns and liquidity protections over the short and long term. Scenario analysis is one way to ensure that the capital needs can be met without sacrifice.
For more information about liquidity modeling and our software GLASS, please contact us here.
1 The Illiquid Asset module in GLASS requires inputs on Commitments, Capital Calls and Distributions. All inputs for this analysis were either public information online or assumptions made by Ortec Finance. Harvard was not consulted for this analysis.