
Our economic and asset return scenarios provide information about what the future might look like. But every now and then one needs to look back at how historical scenario sets compare to how reality has unfolded in terms of actual economic and financial market developments. Based on three years of data we evaluated the true out-of-sample quality of the density forecasts as provided by the Ortec Finance scenarios. The evidence suggests that these historical density forecasts have been quite well in line with how reality unfolded and that therefore we are on the right track with our approach for generating economic and asset return scenarios.
Back-testing as a tool to calibrate and evaluate scenario models
The latest version of our scenario methodology was introduced mid-2016. Our scenarios have always been constructed and calibrated based on robust stylized facts that characterize how economic and financial market variables tend to behave. In addition, we performed large scale out-of-sample back-testing research. This research resulted in a more parsimonious model structure (i.e. one with fewer parameters) and the confirmation that dynamic scenario expectations outperform static ones.
Although immensely useful, one might rightfully object that such back-testing research is only “pseudo out-of-sample” because in the end one uses the whole data-sample to optimize the model calibration. Furthermore, due to data limitations, such back-testing needs to focus “only” on expectations while in reality the whole density forecasts matter. And finally, such automated back-testing excludes other important parts of our methodology such as expert opinion and views, and therefore does not test our complete scenario methodology as it is applied in reality.
But fortunately, by now our scenarios have been updated for every month since mid-2016 for the changes in economic and financial market conditions that took place. This means that we now have three years of data available that we can use for looking back and performing some “true out-of-sample” back-testing.
Performance across asset classes
By pooling this data across forecasting horizons, asset classes and regions we are able to create a picture of the quality of our scenarios for different confidence intervals. Some scenarios are more likely to happen than others. For perfect density forecasts one would want 50% of the realizations to fall in the middle 50% confidence interval, 5% of the realizations in the most left confidence interval, 5% in the most right interval and so forth.
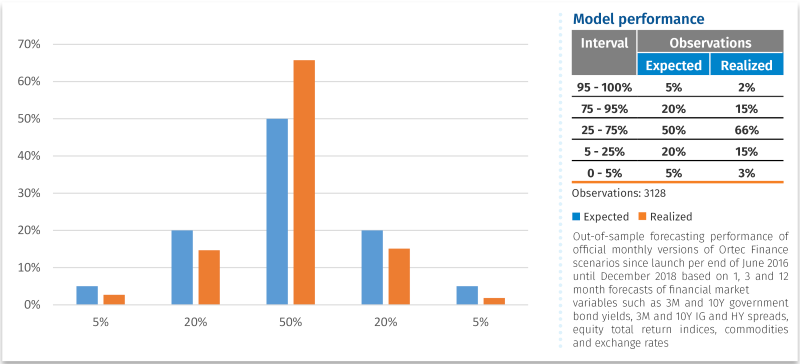
Although this evidence is preliminary, we find that the historical density forecasts represented by our scenarios have been quite well in line with how reality unfolded. Therefore we seem to be on the right track with our approach for generating economic and asset return scenarios.
One area of improvement suggested by the results is that the confidence bands around our outlook may have been somewhat too wide: we find fewer realizations than expected in the outer-left and outer-right confidence intervals. But again, this evidence is very preliminary to act upon. The last few years have for the most part been characterized by economic expansion and bull-market conditions without the bear showing itself all too often. It might just be that as time passes and we collect more data, the missing realizations in the outer confidence intervals will manifest themselves.
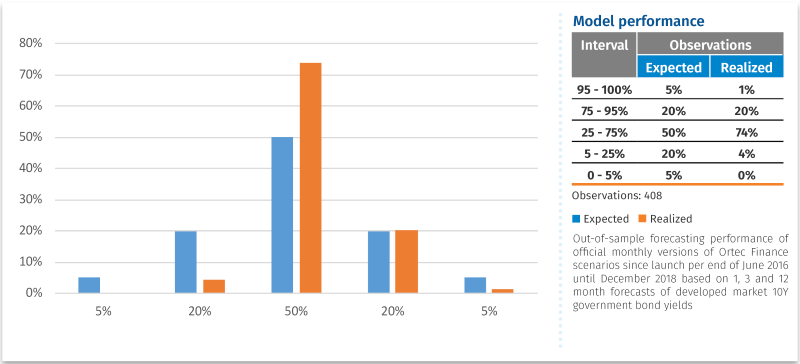
Performance for 10-years interest rate
The results for specific asset classes such as equities, commodities and exchange rates are very similar as the results based on data pooled across asset classes. The most notable exception are the results that we find for interest rates. For example, for 10-year interest rates in developed markets we find that we expected low interest rates to occur more often than what actually happened. Or, stated differently, interest rate increases have occurred more often than we expected. At face value, this provides us with some signs that historically we have been overestimating the probabilities of low interest rates. But also in this case it holds that, as time passes and we collect more data, the missing realizations in the lower confidence intervals might manifest themselves.
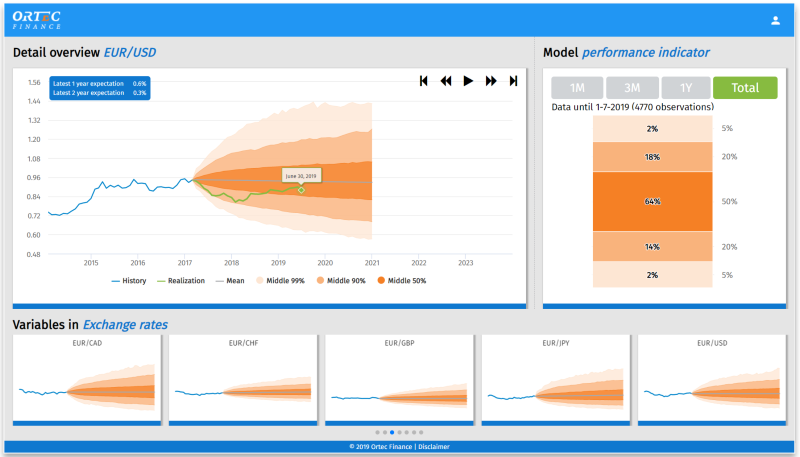
See for yourself?
Are you interested to see the true out-of-sample performance of our scenarios for specific asset classes, economic variables or forecasting horizons for yourself? Then please contact scenariosupport@ortec-finance.com to request access to our web-based scenario app. The scenario app provides easy and interactive insights into the official Ortec Finance economic and asset return scenarios as provided to our clients since mid-2016. Learn all about our Economic Scenario Generator (ESG) solution.
Contact

Hens Steehouwer
Chief Innovation Officer (CIO)Related Insights
-
 20 July 2026GLASS PRISM: A New Standard in Strategic Asset Allocation
The GLASS PRISM launch introduces targeted SAA powered by scenario-based machine learning. Discover what's driving industry attention.
-
 13 July 2026Will advisers have to reposition annual reviews as a premium service to justify their fees?
Can advisers still justify ongoing fees without annual reviews? The FCA's shift may reshape advice business models.
-
 09 July 2026Aviva partners with Ortec Finance to expand access to financial advice
Aviva has selected Ortec Finance as its technology partner to enhance its customer guidance and financial planning proposition.
-
 06 July 2026Quarterly Scenario Webinar Q3 2026 - Energy Shocks and Market Repricing: Navigating the Next Phase
Can we use this for the meta: Join our webinar to explore how renewed US–Iran military conflict could reshape energy markets, inflation, interest rates and investment portfolios.
-
 18 June 2026Virtual panel discussion #2 (Asia-Pacific): Extending the lens on climate change to capital market assumptions
Hear thought-provoking perspectives on climate change’s impact on capital market assumptions, including short and longer-term market pricing dynamics
-
 18 June 2026TPA Quick Wins Article
How to adopt the TPA framework without fully transitioning to TPA.
-
 05 June 2026Strategic Asset Allocation in the “TW-ICS” Era
How Taiwanese insurers can modernize strategic asset allocation and strengthen long-term resilience.
-
05 June 2026Total Portfolio Lens Brochure
Total Portfolio Lens (TPL) is built for investors navigating whole-fund complexity: it connects forward-looking analytics to action and allows investors to evolve at a pace that fits their governance and readiness.
-
 01 June 2026Supporting PKZH in assessing the financial impact of an ESG exclusion policy using PEARL
Learn how we supported PKZH, a Swiss pension fund in understanding the effect of an ESG exclusion policy on total fund performance.