

As part of the regulator’s effort to improve Australia’s superannuation industry’s efficiency, transparency and accountability, the Government’s Your Future, Your Super reforms (the YFYS reforms) came into effect on 1 July 2021. It came to our attention that there has been increasing demand in our client base to build the performance test analysis internally, as requested by various stakeholders within the organization.
We believe there is value-add in sharing some of our learning, experience, and reflections we gained throughout the journey, through this series of two insights. In this first article today, we reflect on some of the practical challenges we have seen in building the calculation of the performance test itself. In the upcoming episode, we will go a step further and look at what kind of narrative can be derived from the performance test via attribution analysis.
The YFYS Performance Test
Under the YFYS reform, APRA is required to conduct an annual performance test for MySuper products (later on to be extended to Choice products) offered by superannuation companies, by comparing the fund’s 8-year rolling annualized return against APRA’s Strategic Asset Allocation (SAA) benchmark. A fund can fail the performance tests if it underperforms by more than 50bps.
Consequences of failing the test are significant. It involves sending a standard letter to its members to inform them of this result. If failing two consecutive years in a row, the fund will not be allowed to accept new members until their net investment performance improves.
The merits and demerits of the YFYS Performance test have been hotly debated amongst investment professions in various forums via articles, papers, interviews, and conferences. Whilst these conversations are still happening, there has been an increasing demand for performance teams to calculate the performance test internally, for obvious reasons, for example:
- To shadow APRA’s calculation
- To track fund’s performance and alert internal stakeholders if the fund gets close to failing the test
- To produce performance test forecast and conduct what-if and scenario analysis
- To perform attribution analysis which may help answer the question: what can be done to improve the test result.
The devil is in the details
Performance team’s initial attempt to create the performance test typically starts in Excel – the ultimate template tooling, with a combination of Excel add-ins for sourcing data, such as Power Query, APIs and Add-ins from various market data vendors or data warehouses.
The calculation of the performance test itself is relatively straight-forward. It can be summarized with the flow chart below. However, when going through the exercise of creating the performance test, we observed quite a few nitty-gritty aspects of the calculation that may worth extra attention.
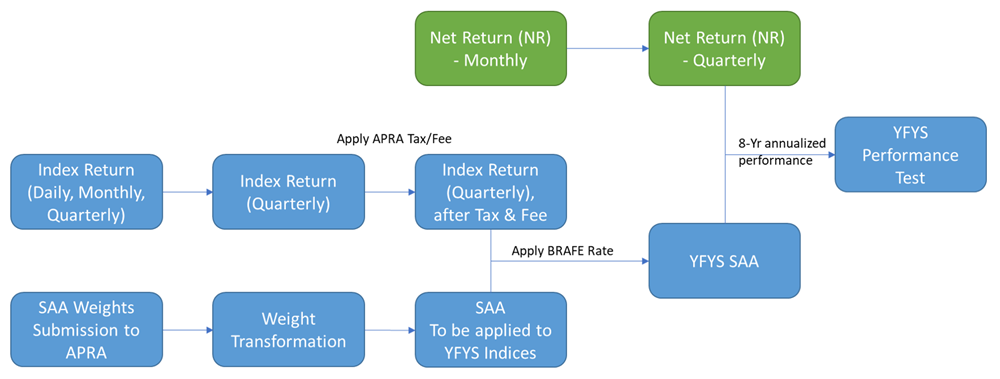
For example, sourcing of benchmark data and preparing for index return calculation may seem straightforward but typically can be quite tricky to handle in Excel. Most of the APRA benchmarks are daily series when coming from benchmark providers, with the exceptions of the quarterly indices for unlisted asset classes. The availability of the benchmark data for the unlisted could result in delayed/lagged data points.
If there is a requirement to calculate the performance test with a higher frequency than quarterly, interpolation might also be necessary for quarterly indices. Another important task, as part of the journey, is to transform the SAA weights submitted to APRA so that they can be applied to the YFYS indices. Complications can arise when:
- Hedging policy is designed at Option level but specified at asset class level in YFYS performance test. APRA has now provided field for supers to submit the hedging ratio at option level and treat currency overlay as a separate asset class. However, the benchmark to be assigned to the currency overlay asset class is still unclear at this stage
- Assumptions made by APRA when domestic/international split is not provided by the fund/not available
- Mapping of internal asset class classifications to APRA asset class classification and the management of historical change over time.
In addition, an audit to review all historical SAA weights submitted to APRA must be conducted to make sure they are accurate.
These considerations add to the complexity of the APRA performance test model built in Excel. Furthermore, there is the element of key-person risk associated with any manually developed Excel template. With the help of a system, embedding a stronger data governance framework coupled with more robust tooling capability, it could help the performance team to manage the requests of analysis in relation to performance test, in a much more efficient and effective way.
What have we done in PEARL
When we looked at creating the performance test in PEARL, we have spent quite some time going through discussions with our clients and contacts to understand their pain points when producing the analysis. We then designed our solution and workflow focused on:
- Minimizing data sourcing effort, including but not limited to, APRA indices return, fees/tax/BRAFE rate, fund asset class level returns which may be required for attribution analysis
- Ease of maintaining APRA assumptions like fees/tax rate through one single configuration allowing changes over time
- Maximizing the efficiency by creating asset class building blocks, allowing for scalability when the test is extended to Choice products
- Flexibility in dealing with delay/lagging/interpolation requirements for quarterly indices
- Allowing for residuals to be quantified, which could arise due to data availability and data quality and calculation frequency.
From Performance Test to Performance Test Attribution
So now you have got the performance test, what now? The next step, which intuitively comes to mind is, indeed, in the attribution. In the context of the YFYS performance test, the attribution framework should provide insights and guidance in terms of what needs to be done to avoid failing the performance test, assess asset class teams and investment managers fairly, and bring the best outcomes to the members. One can and should expect logical flow and consistency between the performance test and the results of the decision attribution analysis. We started exploring an attribution framework intended to measure and quantify impact for several decisions:
- Designing the hedging policy and its implementation – understanding the asset class contributors/detractors relative to the APRA benchmarks
- Determining the admin fee rate
- Managing the tax efficiency
- Selecting funds’ strategic SAA benchmarks which deviates from APRA SAA benchmarks.
In the next episode of this series, we will deep dive into an example of the YFYS performance test attribution and see what kind of insights we may get, and challenges we may run into. Stay tuned.
Contact

Michelle Li
Head of Client Services APAC & Head of AustraliaRelated Insights
-
 06 July 2026Quarterly Scenario Webinar Q3 2026 - Energy Markets & Risk Repricing: Navigating a Fragile Ceasefire
Join our webinar to explore how a fragile US–Iran ceasefire could reshape energy markets, inflation, interest rates and investment portfolios.
-
 18 June 2026Virtual panel discussion #2 (Asia-Pacific): Extending the lens on climate change to capital market assumptions
Hear thought-provoking perspectives on climate change’s impact on capital market assumptions, including short and longer-term market pricing dynamics
-
 18 June 2026TPA Quick Wins Article
How to adopt the TPA framework without fully transitioning to TPA.
-
 05 June 2026Strategic Asset Allocation in the “TW-ICS” Era
How Taiwanese insurers can modernize strategic asset allocation and strengthen long-term resilience.
-
05 June 2026Total Portfolio Lens Brochure
Total Portfolio Lens (TPL) is built for investors navigating whole-fund complexity: it connects forward-looking analytics to action and allows investors to evolve at a pace that fits their governance and readiness.
-
 01 June 2026Supporting PKZH in assessing the financial impact of an ESG exclusion policy using PEARL
Learn how we supported PKZH, a Swiss pension fund in understanding the effect of an ESG exclusion policy on total fund performance.
-
 01 June 2026Ortec Finance publishes its first Sustainability report
Ortec Finance publishes its first Sustainability Report. It covers the reporting years 2024 and 2025.
-
 28 May 2026Captive Insurance vs Run-On: What Do the Numbers Say?
In blog 6 in the series, we look at some specific case studies to highlight how alternative endgame arrangements can deliver meaningful financial benefits for both sponsors and members.
-
19 May 2026TPL: A New Frontier for Holistic Risk Management
This report introduces two closely related concepts that fill the gap between traditional SAA and full TPA.