

Climate change is a complex systemic financial risk
Identify and understand how physical climate risks, low-carbon transition impacts and associated market pricing responses could affect investment portfolios, financial markets and economies.
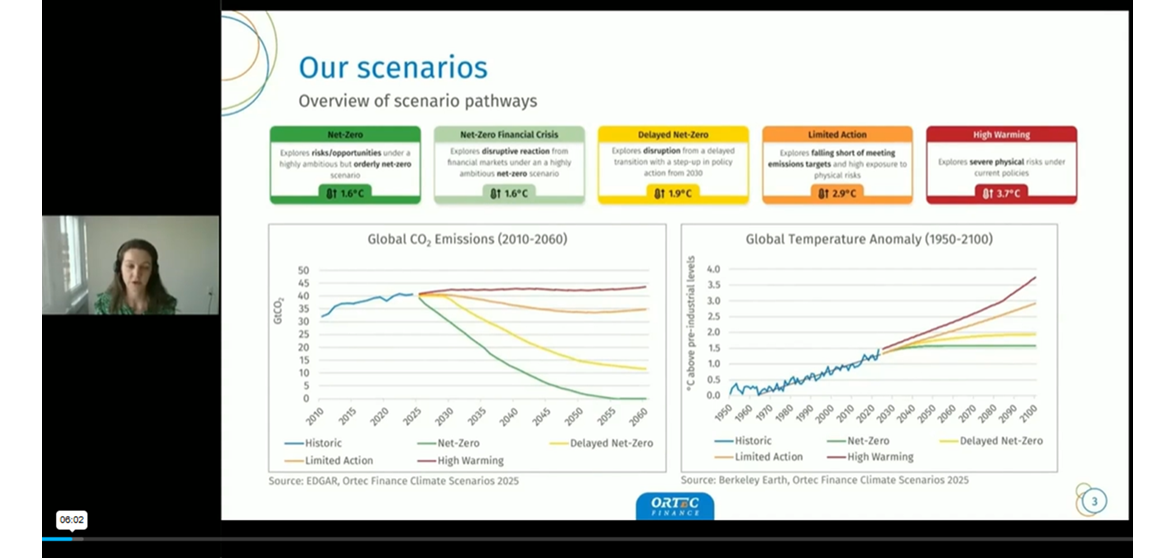
ClimateMAPS is Ortec Finance’s top down climate scenario analysis solution, in exclusive partnership with Cambridge Econometrics, that enables financial institutions to quantify climate change risks and identify opportunities, across all asset classes, macroeconomic variables and sectors.
Prepare for climate change. Translate plausible climate futures into quantified financial impacts.
Measure, monitor and manage total portfolio risk and opportunities
Why manage climate risks with ClimateMAPS? Our climate scenario analysis solution, which primarily utilizes our in-house Ortec Finance Climate Scenarios is:
![]()
Comprehensive
By translating climate risk and opportunities into all asset classes, macroeconomic variables, conventional and green benchmarks and regions and sectors.
![]()
Realistic
By delivering a real-world assessment of systemic transition, physical and market pricing risks
![]()
Integrated
By utilizing a range of advanced models to deliver results that can be integrated with traditional risk analysis and asset liability management (ALM) platforms
![]()
Our climate scenario analysis solution is also available with NGFS Phase V climate scenarios. Learn more about the differences and how to choose the right scenarios to meet your investment objectives.
Climate scenarios can also be customized to a financial institution’s views and assumptions as a bespoke climate scenario.
Utilizing Ortec Finance Climate Scenarios
Deliverables |
Application |
|
AnalyticsEconomic variables for 20+ countries/regions 450+ financial variables across all asset classes, including green benchmarks |
AnalysisUnderstand the financial impacts and outcomes under a wide range of plausible climate change futures |
|
Insights30+ sector-specific impacts for equities Geographical insights including heatmaps |
Stress-testPerform a total portfolio climate stress testing exercise
|
|
AssessmentComprehensive total portfolio analysis including dataset and detailed supplementary report |
Strategy designIntegrate climate change into investment beliefs, capital and strategic asset allocation as well as selection and monitoring |
|
BreakdownIn-depth breakdown of transition, physical and market pricing climate risks for all macroeconomic and asset class impacts |
Risk managementAssess and mitigate climate change from a financial risk management perspective |
|
DashboardInteractive web-based tool featuring dynamic charts, videos and explanations for comparison, with ongoing support and training |
ReportingUndertake stakeholder engagement and climate-related reporting and disclosures |
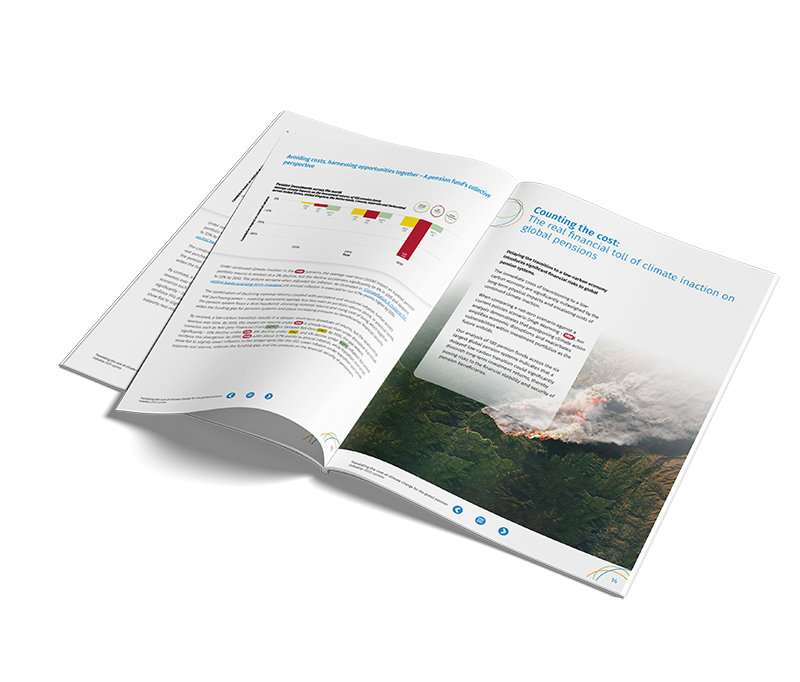
Translating the cost of climate change for pension funds and insurance companies worldwide
Our Climate Scenarios & Sustainability team undertake an annual analysis to assess how climate risk is affecting pension funds and insurance companies globally, using the latest release of our Ortec Finance Climate Scenarios
Climate scenario analysis for financial institutions
ClimateMAPS can meet the climate risk management needs of diverse financial institutions. Learn more about how our climate scenario analysis solution can specifically assist pension funds, insurance companies and asset managers with managing the impacts of climate change.
Understand total portfolio exposure across traditional investment and climate risks
Using ClimateMAPS to identify the impacts on asset class returns of optimized portfolios generated based on ALM studies against the same baseline determined in GLASS.
Support private asset investment decisions
Combine regional, sectoral, macroeconomic, and asset-class impacts to identify private asset opportunities and actively drive investment in the low-carbon transition from a total portfolio perspective.
![]()
Our climate risk management insights
Webinars
Evaluating the pricing impacts of
climate risks

Watch our webinar to explore how our climate change affects asset performance and valuations.
2025 Ortec Finance Climate Scenarios
Watch our webinar to learn how our Ortec Finance Climate Scenarios realistically assesses physical, transition and market-pricing climate risks.
Utilizing NGFS climate scenarios for climate risk analysis
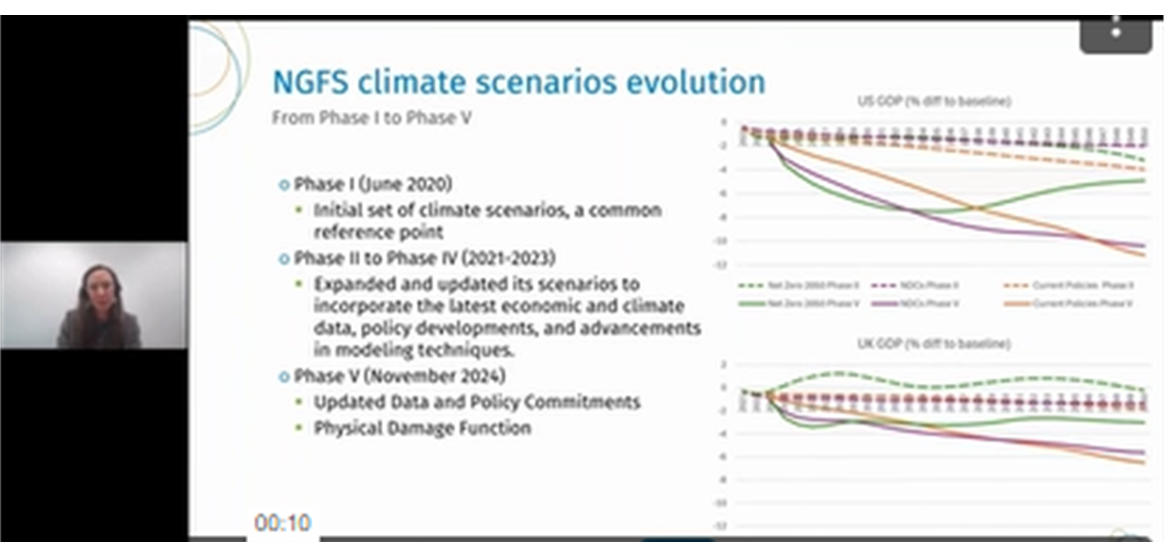
Watch our webinar to understand how NGFS climate scenarios can be utilized for assessing the financial impact of climate change.
Want to learn more about how ClimateMAPS can help financial institutions prepare investment portfolios for the impacts of climate change?


Receive the latest sustainable finance and climate risk management insights
Subscribe to Radar


Contact

Maurits van Joolingen
Managing Director, Climate Scenarios & Sustainability
Hamish Bailey
Managing Director UK, Head of Insurance & Investment
Richard Boyce
Managing Director, North America
Stefano SJ Lee
Managing Director - Asia Pacific
Stacy Howlin
Managing Director, United StatesRelated Insights
-
 03 March 2026Ortec Finance Wins Insurance Asset Risk Technology Provider of the Year
Ortec Finance is proud to announce that it has been named Insurance Asset Risk Technology Provider of the Year at the Insurance Asset Risk Awards 2026. The award recognizes leadership in delivering advanced, transparent and practical technology to help insurers and asset managers make better investment and risk decisions in an increasingly complex world.
-
 26 February 2026Virtual panel discussion: Extending the lens on climate change: Beyond investment strategies to investment policy and capital market assumptions
Hear thought-provoking perspectives on climate change’s impact on capital market assumptions, including short and longer-term market pricing dynamics
-
 18 February 2026Breaking down the Bank of England Prudential Regulation Authority’s guidance on the management of climate-related risks for UK insurers
Explore the BoE’s expectations on how UK insurers should manage climate risks across their balance sheets and embed them into risk management frameworks
-
 26 January 2026Forward Analytics partners with Ortec Finance to enhance their climate transition models
Learn about our partnership with Forward Analytics, as they use the Ortec Finance Climate Scenarios in their forward-looking climate transition models.
-
 19 January 2026How climate change could spark an insurability crisis - and destabilize the global financial system
Learn how a climate-driven insurability crisis could compromise global financial stability.
-
 13 January 2026UK Defined Benefit Pension Schemes: Endgame Strategy Evaluation Using an ALM-Based Approach
Explore DB pension endgame options beyond buy-out. Compare run-on and captive insurance using an ALM-based approach. Download the whitepaper.
-
 10 December 2025Translating the cost of climate change for the European insurance industry: 2025 update
Discover how climate change is impacting insurance companies across the total balance sheet, using the 2025 Ortec Finance Climate Scenarios
-
 10 December 2025Escalating physical risks and climate-linked inflation is challenging insurability and business continuity
Climate change may expose insurers to catastrophic losses that jeopardize overall business continuity
-
 26 November 2025PRESS RELEASE: Ortec Finance Wins Buy-side ALM Product of the Year at the Risk.net Markets Technology Awards 2026
Ortec Finance Wins Buy-side ALM Product of the Year at the Risk.net Markets Technology Awards 2026